What is Overall Equipment Effectiveness (OEE) in Manufacturing
Chasing industrial excellence? So you should know that mastering Overall Equipment Effectiveness (OEE) is pivotal. We’re not only talking about a simple metric, but the heartbeat of enhanced manufacturing and maintenance strategies.
But what exactly is this KPI (Key Performance Indicator) and why does it hold such significance?
At its core, it encapsulates the efficiency and effectiveness of equipment, expressed through the following formula:
OEE = Availability (%) x Performance (%) x Quality (%).
Each component — Availability, Performance, and Quality — offers a lens into the operational health of your manufacturing processes.
The good news? In this article, we’ll delve into each aspect, unpacking their roles in driving industrial success.
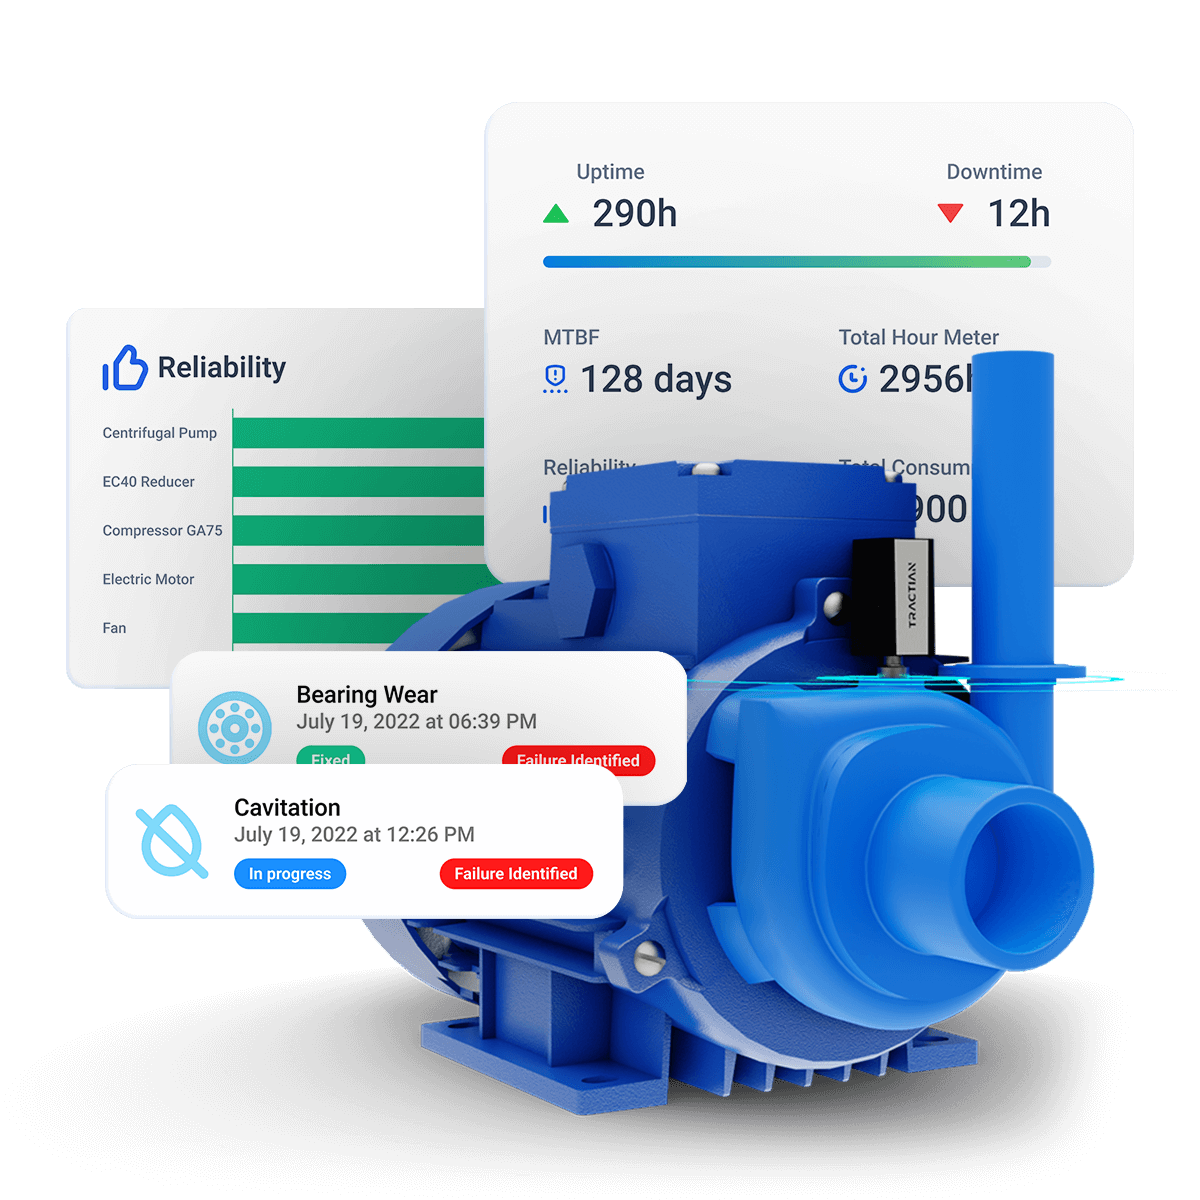
In practice, Overall Equipment Effectiveness serves as a comprehensive metric, integrating various dimensions of manufacturing efficiency. To know the OEE of your machinery, it’s to know how each machine runs, what it produces, and the quality of the output.
Keep reading to discover the power of this metric in optimizing industrial maintenance efficiency.
OEE: The Fundamentals
OEE, or Overall Equipment Effectiveness, is a comprehensive measure that breaks down into three critical components: Availability, Performance, and Quality. It’s one of the most important KPIs for manufacturing businesses.
But… How do these elements interact to offer a holistic view of your operations?
Let’s take a closer look:
- Availability measures the proportion of scheduled time that equipment is operational, highlighting downtime impacts. The question here is: Is your machinery available when you need it, or are unplanned stoppages holding you back?
- Performance assesses whether your equipment operates at the optimal speed, considering factors like minor stoppages and slow cycles. Ask yourself: Are you getting the maximum output during operational hours?
- Quality focuses on the production of defect-free units, pinpointing the rate of products meeting the standards. Answer: How often does your process deliver top-notch results?
Together, these components form the Overall Equipment Effectiveness metric, providing a nuanced picture of equipment and process efficiency in your industry.
The OEE Formula: Breaking Down the Metrics
Understanding the OEE formula is crucial for industrial leaders. It’s calculated as the product of its three components: Availability, Performance, and Quality.
But how do we break down and calculate each?
- Availability is the ratio of actual operating time to planned production time. For instance, if a machine is scheduled to run 10 hours but operates for 7.5, the Availability is 75%.
- Performance considers the speed at which products are manufactured against the ideal rate. If a machine produces 800 units in an hour instead of its maximum capacity of 1,000, the Performance is 80%.
- Quality measures the good units produced versus the total produced (which considers multiple factors, such as customer dissatisfaction, material costs, and rework costs). So, producing 900 “good” units out of 1,000 gives a Quality score of 90%.
Multiplying these percentages gives the OEE value.
In our example, the Overall Equipment Effectiveness would be 75% (Availability) × 80% (Performance) × 90% (Quality) = 54%.
See how palpable it is? It points to the possible root cause of the problem (varying between 3 pillars).
In practice, this number provides a clear, actionable insight into where improvements are needed.
What is a Good OEE Score?
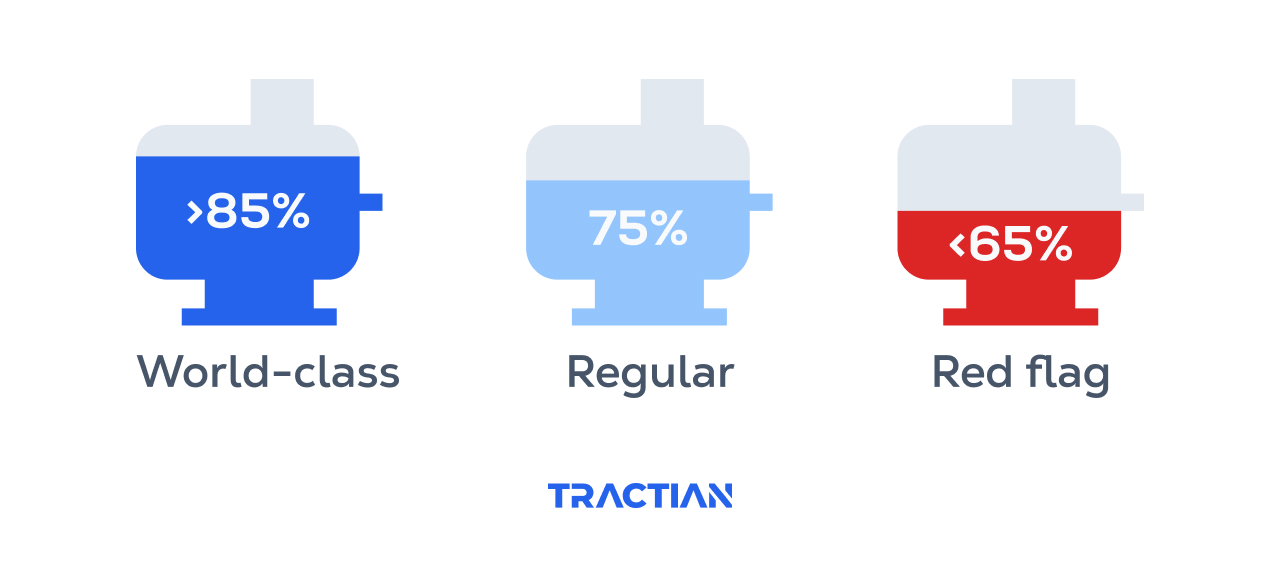
So, how can you tell if your OEE score is actually good? Well, let’s cut it to where it matters: 85% is a remarkable score, pointed by many as “world-class”; everything in between 65% and 75% can be viewed as regular — yet they signal a need for improvement to reach peak performance; below 65%? Houston, we have a problem. This is a red flag.
Manufacturing challenges such as equipment reliability, production bottlenecks, and quality control can be effectively managed with a solid OEE strategy.
By aiming for higher Overall Equipment Effectiveness scores, companies can identify and tackle inefficiencies, reduce waste, and improve productivity.
Here, take a minute to answer some questions:
- How does your organization’s OEE score compare, and what does it reveal about your operational health?
Tell us: Are you leveraging OEE insights to pinpoint and overcome manufacturing hurdles, striving towards that coveted 85% score?
What Does an 85% OEE Score Mean?
As you saw, an 85% OEE score is often hailed as “world-class” in the manufacturing world. Basically, it’s a benchmark for operational excellence.
But what does this figure actually signify, and how should industries navigate these metrics?
For many manufacturers, attaining an 85% Overall Equipment Effectiveness is not just a goal; it’s a symbol of peak efficiency and a testament to a finely tuned process.
However, achieving and sustaining this level is no small feat.
It requires a relentless focus on optimizing every aspect of production, from minimizing downtime and accelerating performance to ensuring near-perfect quality.
On the other end of the spectrum, any Overall Equipment Effectiveness score below 65% is typically viewed as unacceptable. Scores between 65% and 75% are more common and considered average, yet they still hint at underutilized potential.
But remember: these benchmarks are not one-size-fits-all.
Different industries may have varying thresholds for what constitutes a “good” OEE score, influenced by the nature of their processes and the complexity of their operations.
So, while an 85% score is an admirable goal, companies should focus on continuous improvement tailored to their specific context.
OEE in Manufacturing: A Critical Evaluation
As we’ve talked earlier, the significance of Overall Equipment Effectiveness goes far beyond a mere numerical value; it’s a vital indicator of operational health and efficiency.
But how does OEE specifically address the nuanced challenges of manufacturing?
Firstly, the absence of clear objectives can render OEE a mere number rather than a valuable tool.
Defining what you aim to achieve with Overall Equipment Effectiveness — be it enhancing productivity, reducing downtime, or improving quality — is essential for its meaningful application.
Accurate data collection and validation form the backbone of Overall Equipment Effectiveness.
Without dependable data from sensors, PLCs, MES, or ERP systems, your calculations might lead you astray.
Customizing Overall Equipment Effectiveness factors to reflect your specific manufacturing context, like accounting for planned downtime or varying product speeds, is another key consideration.
This customization helps in aligning OEE metrics with your operational realities, but how adaptable is your approach to these adjustments?
Also: fragmented data across different manufacturing units can obscure the true picture of operational efficiency.
A unified data infrastructure not only enhances communication but also fosters cross-organizational learning.
Ask yourself or your team: Are you able to connect and compare data effectively across your operations?
Since we’ve talked about your team, remember that operator engagement is essential.
Their direct involvement and understanding of OEE’s benefits can drive its success. Similarly, addressing labor shortages by highlighting the benefits and growth opportunities within your organization can enhance your metric outcomes.
Lastly, machine downtime remains a critical hurdle.
Ensuring equipment reliability and minimizing breakdowns are essential for maintaining high OEE.
While comparing OEE scores across different processes or machines, it’s imperative to consider their comparability.
What’s the conclusion? Successfully applying Overall Equipment Effectiveness in manufacturing necessitates a strategic, informed approach.
It’s about diagnosing and refining every facet of production to achieve not just operational efficiency, but also long-term industrial excellence.
Analyzing and Improving Your OEE Score
How can you analyze and enhance your OEE score effectively? It starts with a deep dive into the data of each component: Availability, Performance, and Quality.
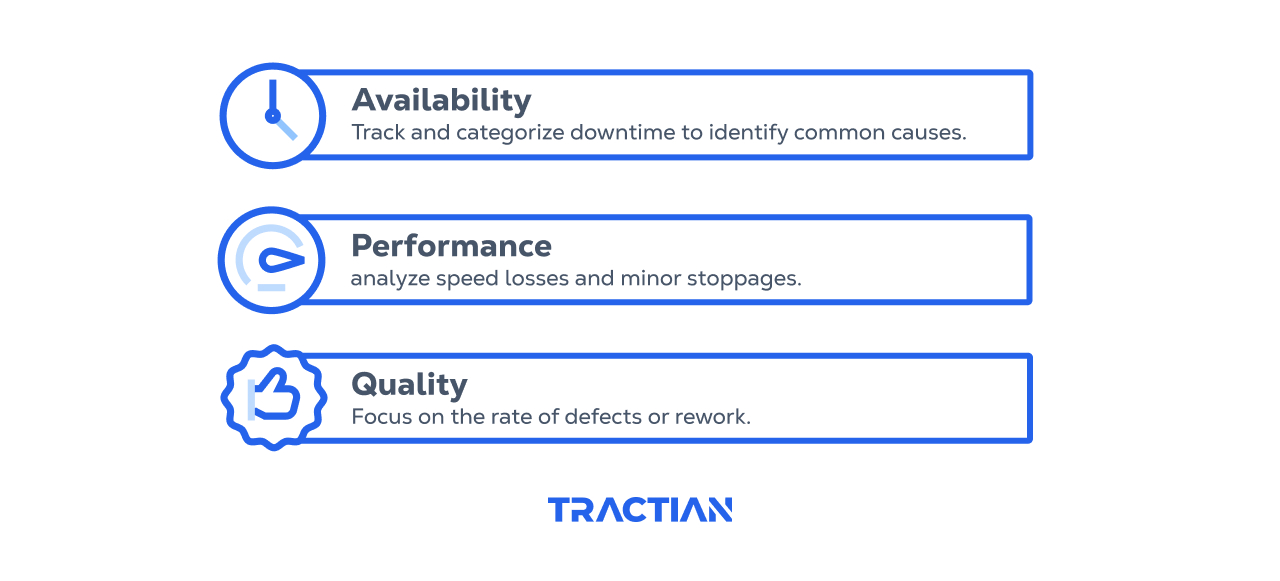
For Availability, track and categorize downtime to identify common causes.
- Are equipment failures or setup times your main culprits?
Implementing preventive maintenance and streamlining changeovers could be key steps to improvement.
In terms of Performance, analyze speed losses and minor stoppages.
- Could refining operational workflows or updating equipment boost your production rate?
Sometimes, even small adjustments can lead to significant gains.
For Quality, focus on the rate of defects or rework.
- Is there a pattern in the production errors?
Enhancing training programs, or adjusting machinery settings might be the solution to producing more first-quality products.
By methodically evaluating and addressing these areas, you can incrementally boost your score.
Tell us: What specific changes can you make today to start this upward trend?
Integrating OEE with Maintenance Strategies
Integrating OEE with maintenance strategies is a game-changer for optimizing asset utilization and minimizing downtime.
But how can this integration be executed effectively?
Consider Overall Equipment Effectiveness as your guiding light: its insights into Availability, Performance, and Quality can directly shape your maintenance planning.
For instance, if your insights reveal frequent downtime due to equipment failures, a preventive maintenance strategy can be prioritized to address these issues before they escalate.
Similarly, when the performance data indicates irregular patterns, predictive maintenance can be employed.
This approach uses data trends to predict when equipment might fail, allowing maintenance to be scheduled proactively, decreasing unexpected breakdowns and associated downtime.
Moreover, with AI and machine learning, AI-assisted maintenance strategies can take OEE data analysis to the next level.
These technologies can analyze vast amounts of data to identify subtle patterns that might not be obvious otherwise, guiding more nuanced maintenance decisions.
Technology’s Role in Enhancing OEE
So, how technology can be of use when dealing with Overall Equipment Effectiveness? We’re talking systems like ERP, CMMS (Computerized Maintenance Management System), EAM (Enterprise Asset Management), along with cutting-edge technologies like IoT, AI, and predictive analytics.
Let’s take a closer look:
ERP and CMMS/EAM systems serve as the backbone for data-driven maintenance, centralizing operational data and facilitating seamless communication across departments.
This integration allows for a holistic view of asset performance, enabling proactive maintenance planning.
But where does the real magic happen? Enter IoT and AI.
With sensors and smart devices, IoT provides real-time data on equipment performance, feeding AI algorithms that predict potential failures.
Imagine knowing exactly when a machine will need maintenance before it even shows signs of slowing down. Isn’t that a remarkable step towards zero unplanned downtime?
Predictive analytics further refines this process, analyzing patterns and trends to forecast future performance and maintenance needs.
As we move forward, the fusion of these technologies with OEE strategies will not only streamline maintenance management but also revolutionize asset optimization.
So, how will your organization harness these innovations to redefine maintenance management and operational efficiency?
Conclusion
The Overall Equipment Effectiveness metric stands as a cornerstone in the foundation of successful maintenance strategies.
It’s the KPI that encapsulates all about the efficiency of your equipment, tying Availability, Performance, and Quality into a single, powerful indicator of operational health.
But remember:
Achieving a world-class OEE score of 85% is a testament to operational excellence, while scores between 65% and 75% should be a call to action for improvement.
Oh, and anything below 65% is a red flag, urging immediate attention.
An extra tip for enhancing your OEE?
Integrate IoT sensors for continuous monitoring of equipment condition. This not only sharpens your maintenance strategy but also fortifies your operational efficiency.
Continuously monitoring and improving your OEE is not just a task — it’s a commitment to better results.
Are you ready to embrace this journey, leveraging every tool at your disposal, to not just reach but sustain peak operational performance?
Share this article

About the author:


David Lee
An experienced leader and sales professional, David started out as an American Veteran and technology enthusiast. As an Account Executive at TRACTIAN, he focuses on problem solving and helping Maintainers increase their ROI using technology.

Share this article

Are maintenance breakdowns affecting your bottom line?
Enter your email to let our experts help you reduce costs now
Almost there, !
We just need a few more informations: